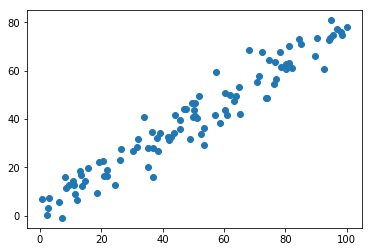
使用PCA去噪
1 | import numpy as np |
1 | X = np.empty((100, 2)) |
1 | plt.scatter(X[:,0], X[:,1]) |
1 | from sklearn.decomposition import PCA |
1 | plt.scatter(X_restore[:,0], X_restore[:,1]) |
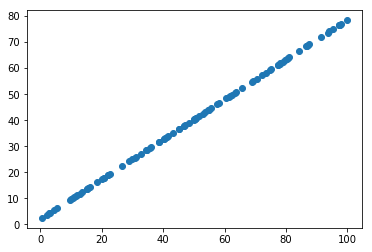
降维的过程可以理解成是去噪。
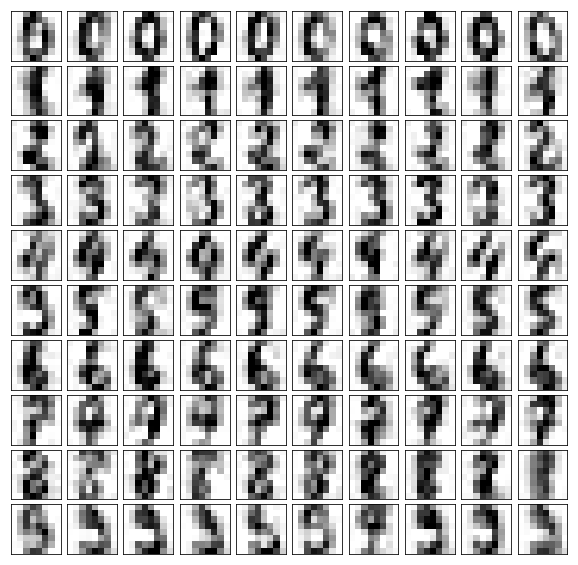
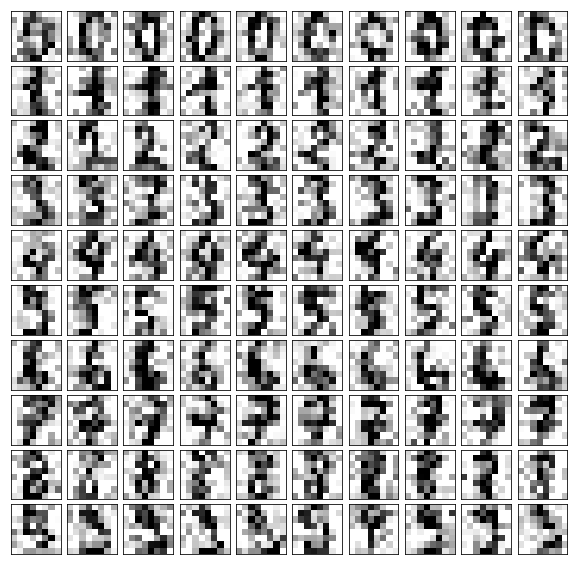
手写识别的例子
1 | from sklearn import datasets |
1 | noisy_digits = X + np.random.normal(0, 4, size=X.shape) |
1 | example_digits = noisy_digits[y==0,:][:10] |
1 | example_digits.shape |
(100, 64)1 | def plot_digits(data): |
1 | pca = PCA(0.5).fit(noisy_digits) |
121 | components = pca.transform(example_digits) |