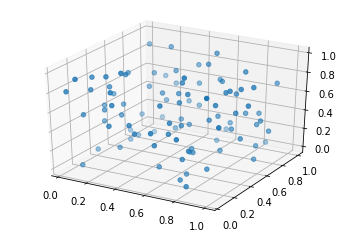
可视化三维样本数据点的PCA过程
1
2
3
4
5
6
7
| import numpy as np
from mpl_toolkits import mplot3d
import matplotlib.pyplot as plt
np.random.seed(8888)
X_random = np.random.random(size=(100, 3))
|
1
2
3
| ax = plt.axes(projection='3d')
ax.scatter3D(X_random[:,0], X_random[:,1], X_random[:,2])
plt.show()
|
demean
1
2
3
4
| def demean(X):
return X - np.mean(X, axis=0)
X_demean = demean(X_random)
|
1
2
3
| ax = plt.axes(projection='3d')
ax.scatter3D(X[:,0], X[:,1], X[:,2])
plt.show()
|
---------------------------------------------------------------------------

NameError                                 Traceback (most recent call last)

<ipython-input-4-94562e6c5eae> in <module>
      1 ax = plt.axes(projection='3d')
----> 2 ax.scatter3D(X[:,0], X[:,1], X[:,2])
      3 plt.show()


NameError: name 'X' is not defined
PCA
1
2
3
4
5
6
7
8
9
10
11
12
13
14
15
16
17
18
19
20
21
22
23
24
25
| def f(w, X):
return np.sum((X.dot(w)**2)) / len(X)
def df(w, X):
return X.T.dot(X.dot(w)) * 2. / len(X)
def direction(w):
return w / np.linalg.norm(w)
def first_component(X, initial_w, eta, n_iters = 1e4, epsilon=1e-8):
w = direction(initial_w)
cur_iter = 0
while cur_iter < n_iters:
gradient = df(w, X)
last_w = w
w = w + eta * gradient
w = direction(w)
if(abs(f(w, X) - f(last_w, X)) < epsilon):
break
cur_iter += 1
return w
|
1
2
3
4
| initial_w = np.random.random(X.shape[1])
eta = 0.01
w1 = first_component(X, initial_w, eta)
w1
|
1
2
3
4
|
X2 = np.empty(X_demean.shape)
for i in range(len(X)):
X2[i] = X[i] - X[i].dot(w1) * w1
|
1
2
3
4
|
ax = plt.axes(projection='3d')
ax.scatter3D(X2[:,0], X2[:,1], X2[:,2])
plt.show()
|
1
2
| w2 = first_component(X2, initial_w, eta)
w2
|
1
2
3
4
|
X3 = np.empty(X2.shape)
for i in range(len(X)):
X3[i] = X2[i] - X2[i].dot(w2) * w2
|
1
2
3
4
|
ax = plt.axes(projection='3d')
ax.scatter3D(X3[:,0], X3[:,1], X3[:,2])
plt.show()
|