1
2
3
4
5
6
7
8
9
10
11
12
13
14
15
16
17
18
19
20
21
22
23
24
25
26
27
28
29
30
31
32
33
34
35
36
37
38
39
40
41
42
43
44
45
46
47
48
49
50
51
52
53
54
55
56
57
58
59
60
61
62
63
64
65
66
67
68
69
70
71
72
73
74
75
76
77
78
79
80
81
82
83
84
85
86
87
88
89
90
91
92
93
94
95
96
97
98
99
100
| import matplotlib.pyplot as plt
import pywt
mode = pywt.Modes.smooth
def plot_signal(data, w, title):
"""Decompose and plot a signal S.
S = An + Dn + Dn-1 + ... + D1
"""
w = pywt.Wavelet(w)#选取小波函数
a = data
ca = []#近似分量
cd = []#细节分量
for i in range(5):
(a, d) = pywt.dwt(a, w, mode)#进行5阶离散小波变换
ca.append(a)
cd.append(d)
rec_a = []
rec_d = []
for i, coeff in enumerate(ca):
coeff_list = [coeff, None] + [None] * i
rec_a.append(pywt.waverec(coeff_list, w))#重构
for i, coeff in enumerate(cd):
coeff_list = [None, coeff] + [None] * i
if i ==3:
print("len(coeff):"+ str(len(coeff)))
print("len(coeff_list):" + str(len(coeff_list)))
rec_d.append(pywt.waverec(coeff_list, w))
fig = plt.figure()
ax_main = fig.add_subplot(len(rec_a) + 1, 1, 1)
ax_main.set_title(title)
ax_main.plot(data)
ax_main.set_xlim(0, len(data) - 1)
for i, y in enumerate(rec_a):
ax = fig.add_subplot(len(rec_a) + 1, 2, 3 + i * 2)
ax.plot(y, 'r')
ax.set_xlim(0, len(y) - 1)
ax.set_ylabel("A%d" % (i + 1))
for i, y in enumerate(rec_d):
ax = fig.add_subplot(len(rec_d) + 1, 2, 4 + i * 2)
ax.plot(y, 'g')
ax.set_xlim(0, len(y) - 1)
ax.set_ylabel("D%d" % (i + 1))
if __name__ == '__main__':
# Get data:
ecg = pywt.data.ecg() # 生成心电信号
index = []
data = []
for i in range(len(ecg) - 1):
X = float(i)
Y = float(ecg[i])
index.append(X)
data.append(Y)
# Create wavelet object and define parameters
w = pywt.Wavelet('db8') # 选用Daubechies8小波
maxlev = pywt.dwt_max_level(len(data), w.dec_len)
print("maximum level is " + str(maxlev))
threshold = 0.04 # Threshold for filtering
# Decompose into wavelet components, to the level selected:
coeffs = pywt.wavedec(data, 'db8', level=maxlev) # 将信号进行小波分解
plt.figure()
for i in range(1, len(coeffs)):
coeffs[i] = pywt.threshold(coeffs[i], threshold * max(coeffs[i])) # 将噪声滤波
datarec = pywt.waverec(coeffs, 'db8') # 将信号进行小波重构
mintime = 0
maxtime = mintime + len(data) + 1
# 绘图
plt.figure()
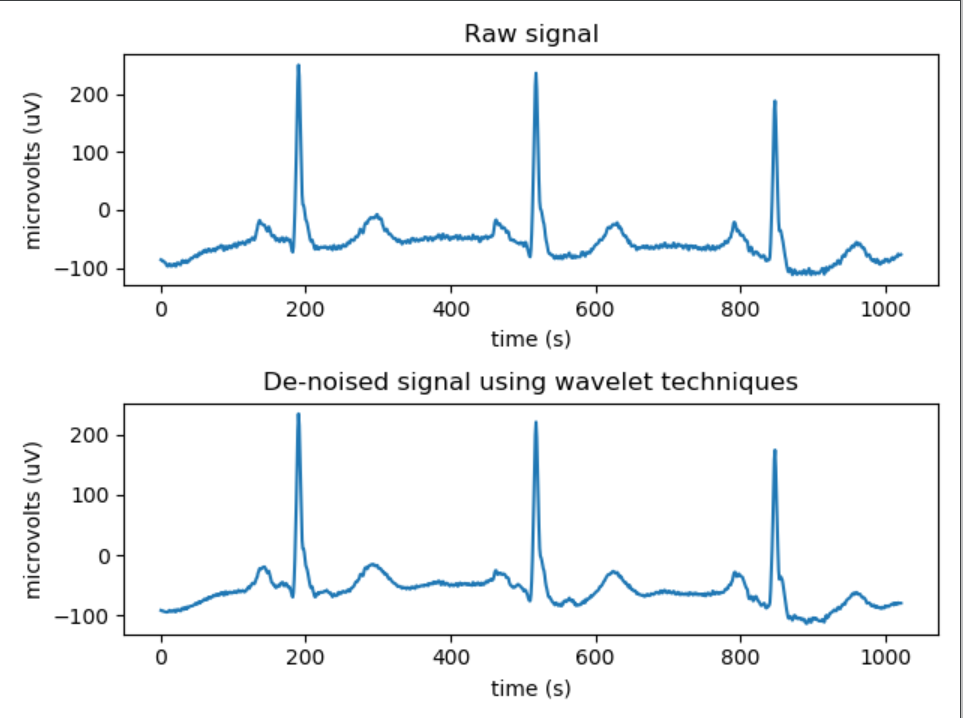
plt.subplot(2, 1, 1)
plt.plot(index[mintime:maxtime], data[mintime:maxtime])
plt.xlabel('time (s)')
plt.ylabel('microvolts (uV)')
plt.title("Raw signal")
plt.subplot(2, 1, 2)
plt.plot(index[mintime:maxtime], datarec[mintime:maxtime - 1])
plt.xlabel('time (s)')
plt.ylabel('microvolts (uV)')
plt.title("De-noised signal using wavelet techniques")
plt.tight_layout()
plot_signal(datarec, 'sym5', "DWT: Ecg sample - Symmlets5")
plt.show()
|